
Understanding how to find the range is an important part of mathematics and statistics. The range helps measure how spread out numbers are in a set of data. It is one of the simplest ways to understand variation and is commonly used in school math, business analysis, science, and graphing functions. Whether you are working with test scores, temperatures, or mathematical equations, learning how to calculate the range can make data easier to understand.
The basic idea of range is simple. You subtract the smallest value from the largest value in a set. The answer tells you how wide the data spreads. Even though the concept is straightforward, range can be applied in different mathematical situations, including statistics and algebra.
How to Find the Range of a Data Set
Learning how to find the range of a data set begins with organizing the numbers from smallest to largest. Once the numbers are arranged, identify the highest and lowest values. Subtract the smallest number from the largest number to get the range.
For example, imagine a data set containing the numbers 4, 8, 12, 15, and 20. The smallest number is 4, and the largest number is 20. Subtracting 4 from 20 gives a range of 16.
Range is useful because it quickly shows how much variation exists in the data. A small range means the numbers are close together, while a large range means the numbers are more spread out. Teachers often use range to explain differences in student scores, while businesses use it to study sales trends and performance changes.
When working with negative numbers, the process remains the same. If the numbers are -10, -3, 2, and 7, the smallest number is -10 and the largest number is 7. Subtracting gives 17 as the range.
Although range is easy to calculate, it does not always provide a complete picture of data distribution. Extreme values can heavily affect the result. Even so, it remains one of the most widely used measurements in mathematics because of its simplicity and usefulness.
How to Find the Interquartile Range
Another important statistical concept is understanding how to find the interquartile range. The interquartile range, often abbreviated as IQR, measures the spread of the middle 50% of a data set. Unlike the regular range, it is less affected by outliers or unusually large and small values.
To calculate the interquartile range, first arrange the numbers in order from smallest to largest. After that, determine the lower quartile (Q1) and upper quartile (Q3). The interquartile range is found by subtracting Q1 from Q3.
For example, consider the data set 2, 4, 6, 8, 10, 12, and 14. The median is 8. The lower half is 2, 4, and 6, while the upper half is 10, 12, and 14. Q1 equals 4, and Q3 equals 12. Subtracting 4 from 12 gives an interquartile range of 8.
The interquartile range is especially useful in statistics because it focuses on the center of the data. This makes it more reliable when outliers are present. Researchers and analysts often use IQR to compare distributions and identify unusual values in a data set.
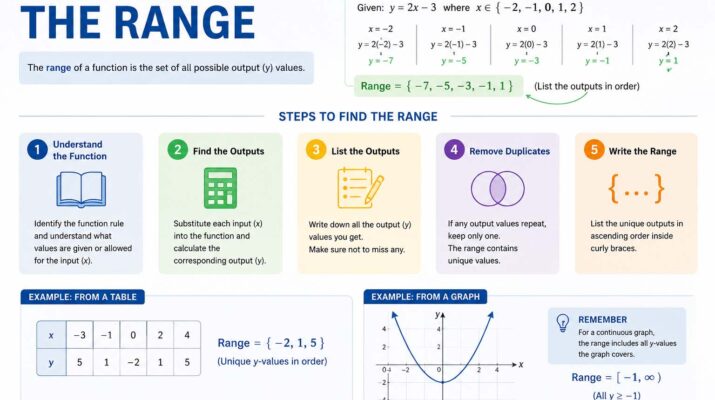
How to Find the Range of a Function
In algebra, students often learn .Unlike statistical range, the range of a function refers to all possible output values of the function. It describes the values that the variable y can take after substituting values for x.
To determine the range of a function, first examine the equation carefully. Consider the behavior of the graph and identify the possible y-values. Graphing the function can make this process easier because the graph visually shows all outputs.
For example, in the function:y=x2
the smallest possible value of y is 0 because squaring any number cannot produce a negative result. Therefore, the range is all values greater than or equal to zero.
Another example is the linear function:y=2x+3
This function continues infinitely in both positive and negative directions. Because of this, the range includes all real numbers.
When finding the range of more complex functions such as square roots or rational equations, restrictions may apply. A square root function cannot produce negative outputs, while fractions may have values that are undefined.
How to Find the Domain and Range of a Function
Students also need to understand together. The domain refers to all possible input values, while the range represents all possible output values.
To find the domain, identify values that can legally be substituted into the function. Certain operations such as division and square roots create restrictions. For example, division by zero is undefined, and square roots cannot contain negative numbers under the radical in real-number mathematics.
Consider the function:y=x−1
For this equation, the value inside the square root must be zero or greater. Therefore, x must be at least 1. The domain is all values greater than or equal to 1. Since square roots cannot produce negative outputs, the range is all values greater than or equal to 0.
Now consider the rational function:y=x−21
The denominator cannot equal zero, so x cannot be 2. The range includes all real numbers except 0 because the function never produces an output of zero.
Graphing functions often makes domain and range easier to visualize. By looking at how far the graph extends horizontally and vertically, students can identify valid input and output values more clearly.
Conclusion
Learning how to find the range is an essential math skill that applies to statistics, algebra, and data analysis. Whether you are calculating the range of a data set, studying how to find the interquartile range, or exploring understanding these concepts helps improve problem-solving abilities.


